Architecture report and JSON
analyze writes two files under <analyzed-root>/.nklattice-report/ by default:
| File | Use |
|---|---|
report.html |
Open locally in a browser. Styles, script, and report data are embedded; it does not need a server or remote script. |
analysis.json |
Inspect complete structured data or feed your own review and CI scripts. |
Pass --output DIR to choose another directory. Relative DIR is resolved from the terminal’s current working directory, not from the analyzed root.
For screenshots of the generated interface with measured aggregate data and redacted source identifiers, see the anonymized React analysis example. The raw report is not published.
Read the HTML report
Section titled “Read the HTML report”Start with the module count. A score from a tiny or unintended scan is not useful. Then review the weighted score breakdown and filter findings by severity, category, or text. The report displays 25 matching findings at a time; Show 25 more findings reveals the next set without changing the filter. Each finding shows a rule ID, file and line, observed evidence, and a recommended next step.
The hotspots list ranks files by a simple priority count: error 5, warning 2, info 1. Its “estimated recovery” text is an estimate, not the score formula or a guaranteed gain. Quick wins list selected info findings and duplicate imports. The refactoring roadmap groups the top-ranked files for review; it is not an automatic change plan.
The graph lets you select any scanned module as the focus. It shows up to 12 directly connected modules at a time, ranked by connection count, and distinguishes incoming from outgoing imports. Select a neighboring node or use the focus selector to continue exploring. The side panel shows the full path, line count, and incoming/outgoing counts. The picture is a focused view; all scanned modules and resolved edges remain in analysis.json.
JSON structure
Section titled “JSON structure”The top-level fields are schema (urn:nklattice:analysis:1), generatedAt, project, graph, findings, score, and actions.
graph.modulesincludes file metrics and import details;graph.edgeslists resolved local edges.findingscontains the complete rule evidence and recommendation objects.scoreincludes the final score, grade, category deductions, weights, and adjustments.actionscontains hotspots, quick wins, and prioritized file summaries.
For example, a script can inspect findings[*].severity or score.score. analyze itself still exits 0 when findings exist. Version 0.5.0 includes central architecture, dependency, quality, security and compatibility gates through governance collect and assess.
Dependency governance has a separate JSON result from lattice governance check --json; it does not write report.html or analysis.json. Its findings[*].expected field contains the required minimum range (for example, >=19.3.1 in the source policy), alongside declared, lockfileSpecifier, locked, and reason. Governance exits 7 when those findings are present.
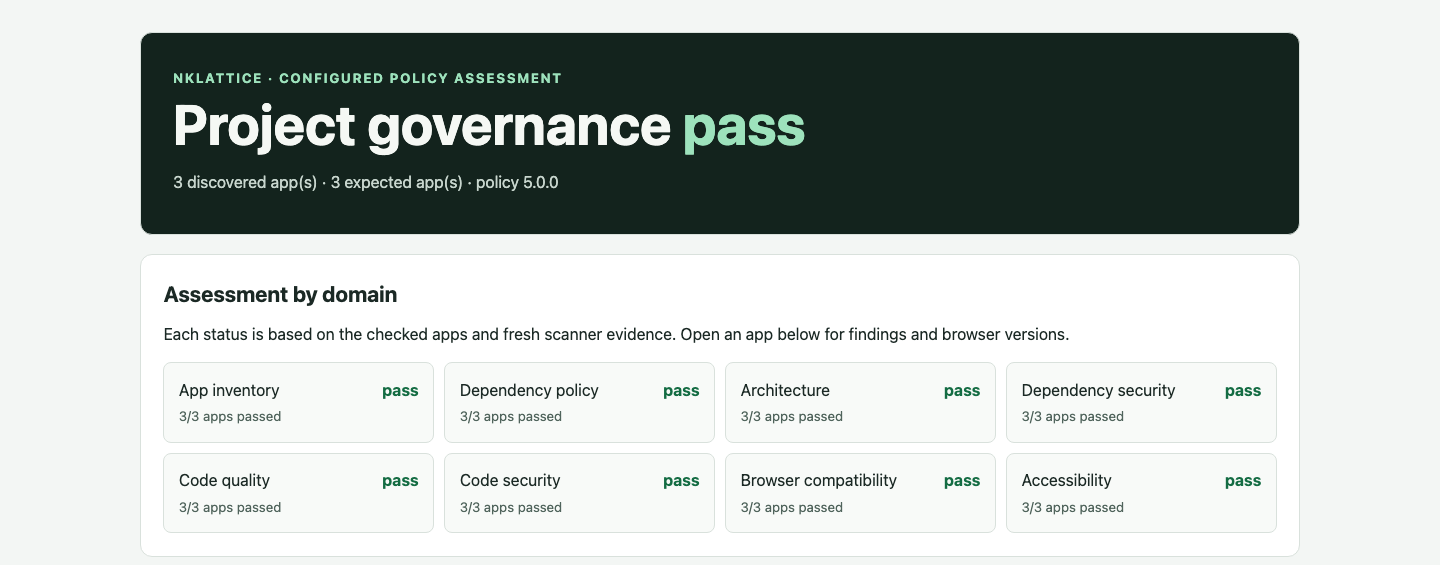
governance assess writes a different pair under .nklattice-governance/: assessment.json and a self-contained report.html. The JSON includes all eight domain statuses per app, measured security and quality findings, coverage, observed browser project versions, configured mobile OS emulation and their policy floors, viewports, evidence identity and the limits of the verdict. The HTML opens with a domain summary, then provides app-level evidence. See the sample governance report capture, generated from the three included sample apps. This report does not replace the exploratory analyze graph report.
History and sharing
Section titled “History and sharing”Before writing a new report to the same output directory, NKLattice moves any existing report.html and analysis.json into history/<timestamp>-<id>/. It does not calculate deltas between runs. Compare saved reports only when the scanned paths and .nklattice.json settings are comparable.
Reports can contain source paths, import names, rule evidence, and policy recommendations. Review them before sharing outside the repository. If reports are local artifacts, add .nklattice-report/ to the app’s .gitignore. The generated report interface is currently in English, while this website’s guides are bilingual.
The anonymized screenshots linked above were captured with CLI 0.2.0. They document that measured run; version 0.5.0 has a separate eight-domain governance report alongside the architecture report.